Texas Peak Demand Grew 22%. Its Dispatchable Thermal Fleet Grew 3%.
Thermal Coverage Ratio, Part 1 of 5: ERCOT, 2019 to 2026
About
Most conversations with data center developers end up in the same place - not cost, and not carbon but timing. Then discussions move to what is really standing behind the electricity connection at 9 pm on the hottest night of the year?
For a long time the answer in Texas and much of the developed world was reassuring. There was plenty of gas and coal capacity that would start when asked. You could argue about price, but the plants were there.
I’m less sure of that now, so I went looking for a number that would settle it, and couldn’t find one. Reserve margins blend everything together. Interconnection queues tell you what might get built, not what has. Nobody seemed to track the simple thing: how much of the peak still rests on plants you can actually dispatch when required?
So I’ve built it, unit by unit, from public EIA data - the result was starker than I expected.
If you’re planning a large load in Texas, the connection is only half the question. The other half is what stands behind it once the sun goes down. That means talking about firm capacity, on-site generation and duration, and I think more of us should be having that conversation openly.
ERCOT Thermal Coverage Ratio
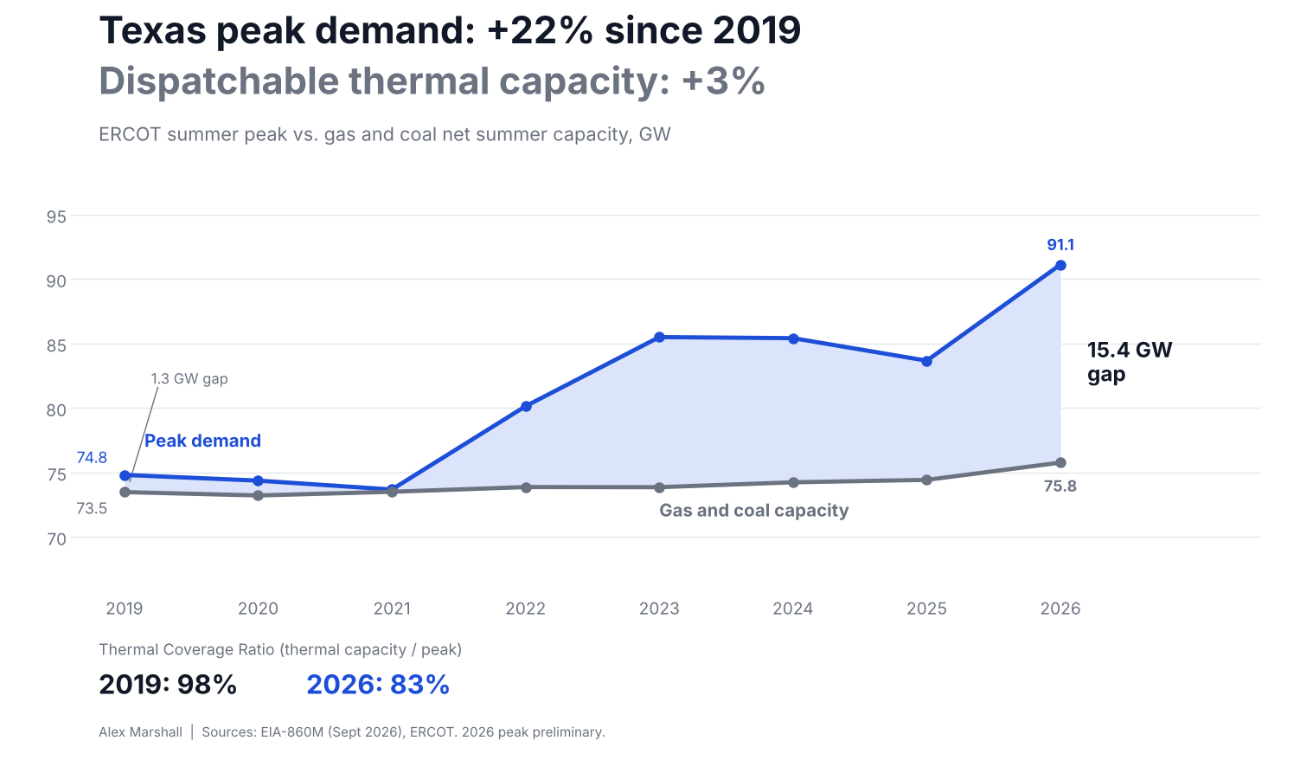
In August 2019, ERCOT's summer peak was 74,820 MW. Gas and coal plants able to run on command totaled 73,487 MW. Thermal capacity alone covered 98% of the peak.
On July 22, 2026, ERCOT set a new record of 91,134 MW. The same fleet stood at 75,775 MW. Coverage had fallen to 83%. The gap between peak demand and dispatchable thermal capacity grew from 1.3 GW to 15.4 GW in seven years.
I call this the Thermal Coverage Ratio. It is a simple measure. Nobody publishes it. This is the first of five markets I am building it for.
What the ratio measures
The Thermal Coverage Ratio divides dispatchable thermal capacity by summer peak demand. Thermal here means gas and coal plants that run when dispatched, whatever the weather or time of day.
It is not a reserve margin. ERCOT does not need thermal plants to cover the whole peak, and nobody is arguing it should. Wind, solar and batteries all contribute. The ratio answers a narrower question: how much of the peak rests on capacity that does not depend on weather?
That question matters more each year. It matters most to anyone planning a large, flat, 24-hour load.
ERCOT Thermal Coverage Ratio numbers 2019-2026
| Year | Summer peak (MW) | Core thermal (MW) | Ratio | Gap (MW) |
|---|---|---|---|---|
| 2019 | 74,820 | 73,487 | 98.2% | 1,333 |
| 2020 | 74,376 | 73,226 | 98.5% | 1,150 |
| 2021 | 73,687 | 73,510 | 99.8% | 177 |
| 2022 | 80,148 | 73,875 | 92.2% | 6,273 |
| 2023 | 85,508 | 73,866 | 86.4% | 11,642 |
| 2024 | 85,425 | 74,246 | 86.9% | 11,179 |
| 2025 | 83,679 | 74,435 | 89.0% | 9,244 |
| 2026 | 91,134 | 75,775 | 83.1% | 15,359 |
The ratio held near 100% through 2021 then it broke in 2022 and has not recovered. The 2025 uptick is weather, not new capacity. A milder summer lowered the peak but the fleet size barely moved.
| Measure | Value |
|---|---|
| Nameplate capacity | 19,195 MW |
| Energy capacity | 31,720 MWh |
| Average duration | 1.65 hours |
| Share of capacity under 2.5 hours | 97.2% |
| Capacity at 3.5 hours and longer | 487 MW |
| Battery capacity as a share of the 2026 gap | 125% |
| Hours the fleet could cover the gap, fully charged | 2.07 |
| Installed since 2021 | 98.9% |
What got built, and what didn't
The thermal fleet grew by a net 2,288 MW over seven years. The composition of that change tells its own story.
Combined cycle: almost nothing. Capacity sat at 39.5 GW in 2019 and 39.6 GW in 2026. Only 232 MW of new combined cycle entered service after August 2019.
Combustion turbines: up 3.6 GW, from 6.47 GW to 10.1 GW.
Reciprocating engines: up 0.6 W, from 0.8 GW to 1.4 GW. The fastest growth of any thermal technology, from a smaller base.
Coal: down 1.3 GW.
Gas steam: down 0.8 GW.
Texas built peakers, not baseload power plants. Nearly every new thermal megawatt since 2019 is a unit planned to start fast and run for hours, not months. That is a rational response to a market with growing solar and sharp evening ramps. It also means the firm, efficient, around-the-clock part of the fleet has not grown at all.
Texas did not stop building firm-looking capacity, though. It built batteries. By September 2026, ERCOT had 19.2 GW of battery storage, nearly all of it installed since 2021. That is more than the entire 15.4 GW gap. The thermal story and the storage story are the same story: Texas has been solving for the peak hour, not for the long night.
What filled the gap
On the record day, EIA reports that natural gas supplied 48% of ERCOT’s generation at the peak hour and solar supplied 32%. The peak came at 6 pm Central. Solar was still producing.
That is the system working as designed. At a 6 pm peak, the 15 GW gap is covered by sun, wind and storage. The harder hours come later. ERCOT’s own summer outlook flagged the 8 pm to 9 pm window as a key challenge, because demand stays high as solar output falls away.
Storage is the strongest answer to that window, and it deserves a precise look. ERCOT’s 19.2 GW of batteries hold 31.7 GWh of energy. That is an average duration of 1.65 hours. About 97% of the fleet by capacity is rated under 2.5 hours. Only about 0.5 GW can run for four hours or longer.
In theory, a fully charged fleet dispatched at full output could cover a 15 GW gap for about two hours after sunset. In practice, batteries are rarely all full at once, and they are also managing ramps and ancillary services. On most summer evenings that is enough. The question this series keeps returning to is the evening when it isn’t.
The Thermal Coverage Ratio is measured against the annual peak. The binding constraint is increasingly the evening shoulder, where solar fades and storage duration runs out. That is the next question this series will test.
Implication for data centers
Data centers are flat loads. They draw nearly the same power at 9 pm in August as at noon in April. They need firm capacity behind them, not average capacity.
A falling Thermal Coverage Ratio does not mean the grid cannot serve new load. It means each new megawatt of flat demand leans more on weather-dependent resources, storage duration, and evening ramps. Three consequences follow for anyone siting large load in Texas:
Firm capacity is becoming a scarce attribute in its own right. It is no longer something a large load can assume comes with an interconnection.
On-site and behind-the-meter generation changes the arithmetic. A large load that brings its own dispatchable capacity adds to the numerator rather than drawing down the margin. That is a different conversation with a utility than a request for capacity.
Duration matters more than nameplate. A peaker built to run a few hundred hours a year is not the same asset as a plant built to run for 8,000. A 1.65-hour battery is not the same as a resource that runs through the night. Texas has added megawatts quickly. It has added far fewer hours.
Method
Numerator: net summer capacity of gas combined cycle, gas combustion turbine, gas steam, gas reciprocating engine, and coal units in the ERCOT balancing authority. Source: EIA Form 860M, September 2026 inventory, Operating and Retired tabs combined.
Timing: a unit counts in a year if it entered commercial operation before the peak month and retired after it.
Denominator: ERCOT's published annual summer peak (hourly). The 2026 figure is preliminary.
Excluded: nuclear (4,980 MW, firm but not load-following), imports over DC ties, demand response, wind, solar and storage. Including nuclear would add about 5.5 points in 2026.
Broad variant: adding petroleum, other gases and biomass lifts 2026 to 84.1%. The finding does not change.
Storage, reported separately: 19.2 GW nameplate and 31.7 GWh of battery energy capacity in the ERCOT balancing authority (EIA-860M, September 2026). Excluded from the ratio because its contribution depends on duration and state of charge, not capacity alone.
Known limits. EIA-860M records each unit's current summer rating, so uprates and derates since 2019 are not reflected historically. About 1.7 GW of counted thermal capacity is now listed as out of service. Removing it lowers 2026 to 81.3%. The ratio is weather-sensitive, because a hot summer lifts the peak. Every unit and figure is in the downloadable workbook.
What comes next
This is Part 1 of 5. Dominion (PJM), Georgia, Arizona and Ohio follow over the coming weeks, each built the same way from the same source. Then a five-market comparison.
If you plan, finance, or build in one of these markets and see something I have missed, I want to hear it. The method improves when people test it.
Disclosure: This analysis is my own, uses only public data, and is published independently.
Sources
EIA Preliminary Monthly Electric Generator Inventory (Form 860M)
EIA: Hourly peak load in ERCOT set a new record, exceeding 91 GW on July 22
Five Nines and Fast Power
Making Better Decisions in AI Energy Investments
Q&As
What is the Thermal Coverage Ratio?
It divides dispatchable thermal capacity by summer peak demand. Thermal means gas and coal plants that run when dispatched, regardless of weather. It measures how much of the peak rests on capacity that does not depend on the sun or the wind.
What did it show for ERCOT?
Coverage fell from 98.2% in 2019 to 83.1% in 2026. Summer peak demand grew 22%, from 74,820 MW to a record 91,134 MW. Dispatchable thermal capacity grew 3%, from 73,487 MW to 75,775 MW. The gap between them grew from 1.3 GW to 15.4 GW.
Is this the same as a reserve margin?
No. A reserve margin counts all resources, usually weighted by their expected contribution. This ratio counts only dispatchable thermal capacity. Nobody argues thermal should cover 100% of the peak. The ratio shows how much of the system’s peak depends on weather-dependent resources and storage.
Why is nuclear excluded?
Nuclear is firm, but it does not follow load. The ratio is meant to capture capacity that can be dispatched up and down on command. Including ERCOT’s 4,980 MW of nuclear would add about 5.5 points in 2026. The trend is the same.
Why did the ratio rise in 2025?
Weather. The 2025 summer was milder, so the peak fell to 83,679 MW. The thermal fleet barely changed. The ratio dropped to its lowest level when the 2026 record arrived.
What thermal capacity has Texas built since 2019?
Mostly peakers. Combustion turbines grew by about 3.6 GW and reciprocating engines by about 0.6 GW. Combined cycle capacity stayed flat at about 39.6 GW. Coal and gas steam retirements removed about 2.1 GW.
What does this mean for data centers in Texas?
Data centers are flat, around-the-clock loads. A falling ratio means each new megawatt of flat demand leans more on solar, wind, storage duration and evening ramps. Firm capacity is becoming a scarce attribute in its own right. Loads that bring their own dispatchable generation add to coverage rather than drawing it down.
Where does the data come from?
Capacity comes from EIA Form 860M (September 2026 inventory), combining operating and retired units in the ERCOT balancing authority. Peak demand comes from ERCOT’s published records. The downloadable workbook lists every unit behind every number.
Which markets are next?
Dominion (PJM), Georgia, Arizona and Ohio, built the same way from the same source. A five-market comparison follows.