Mumbai's Data Center Question Is Firm Power, Not Fast Power
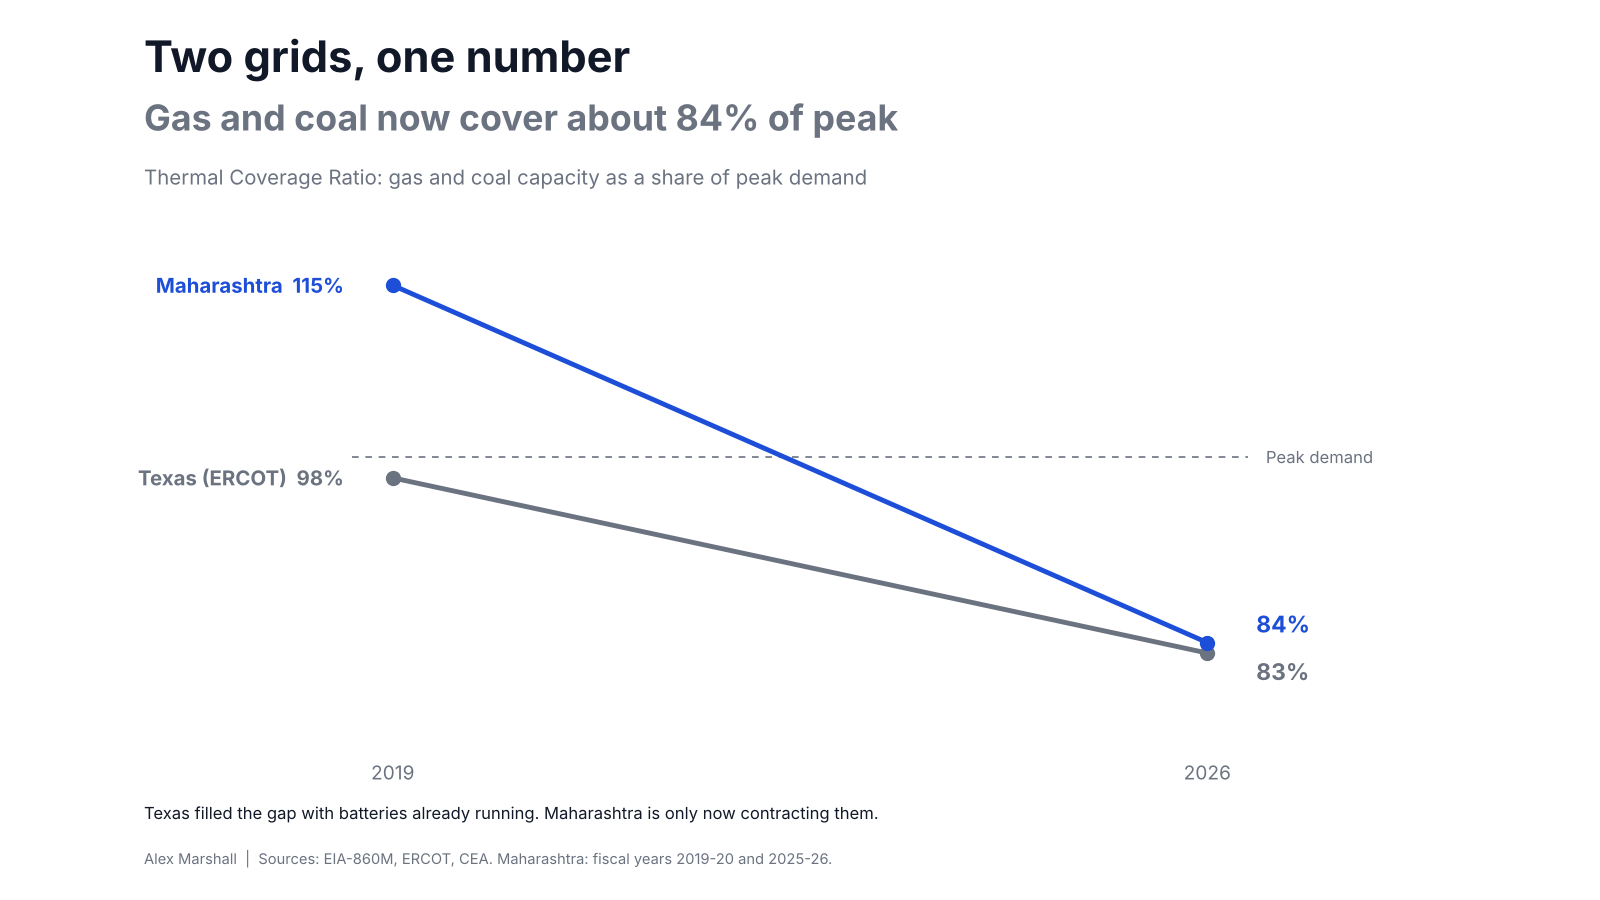
I said Mumbai is the exception worth watching. Using the same measure I built for Texas, Maharashtra's firm margin has gone from surplus to shortfall in six years.
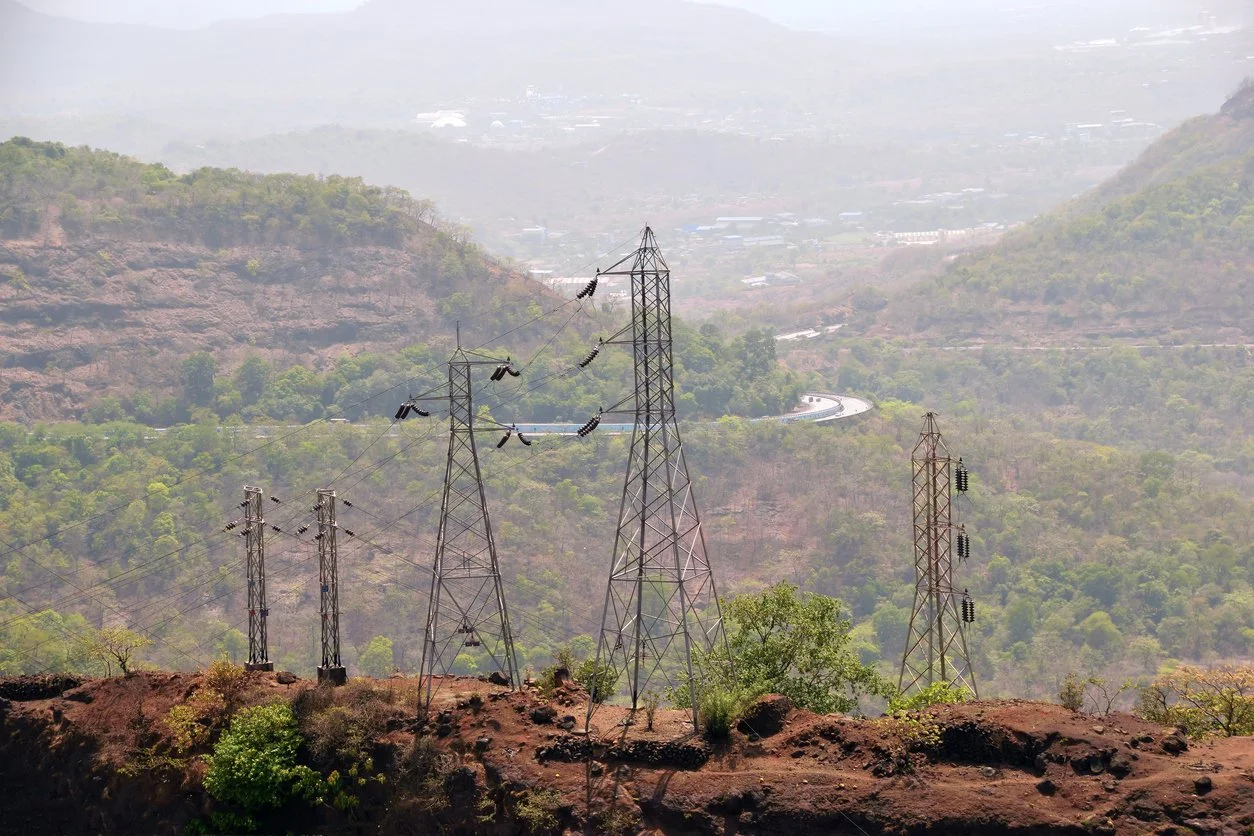
Electricity pylons on the Mumbai to Pune Expressway, Maharashtra, India
In Cheap Coal, Expensive Flexibility I argued that speed to power, the case for onsite generation at US data centers, does not apply to most of India. The grid is cheap and available. The questions therefore about are cost and carbon, not time. I named Mumbai as the exception, and said I would keep watching it.
Two weeks ago I published the Thermal Coverage Ratio for Texas. It is a simple measure: how much of a grid's peak demand could be met by gas and coal plants alone. In Texas it fell from 98% to 83% in seven years. I wanted to know what the same number says about Maharashtra, potential home to a significant proportion of India's new data center capacity.
During the recent UK trade delegation to New Delhi and Mumbai, it was clear that there was an understanding from the Indian Government that the challenges associated with peak demand from ever greater amounts of solar must be addressed, despite underlying firm coal power and growing numbers of battery energy storage systems.
Renewables, Thermal Capacity Numbers in Maharashtra
In mid-2020, Maharashtra had 28.2 GW of coal and gas capacity located within its borders, according to Central Electricity Authority (CEA) records. Peak demand in fiscal year 2019-20 was 24,550 MW. Thermal capacity covered 115% of the peak, with about 3.6 GW to spare.
By mid-2026, coal and gas capacity had fallen to 26.1GW. Peak demand in fiscal year 2025-26 was 31.1GW. Coverage had fallen to 84%. The state's own gas and coal fleet now sits about 5GW short of its peak.
Peak demand grew 27% in six years, but thermal capacity fell 7%. Renewable capacity roughly tripled, from 9.8GW to 30.1GW.
The headline number is generous. It counts gas at full rated capacity, although most of India's gas fleet runs little because imported liquefied natural gas (LNG) is expensive. If you take coal alone the ratio is 75%.
Similarities and Differences with Texas
Texas added a little thermal capacity and a lot of demand. It filled the gap with 19 GW of batteries, most of them short-duration. Maharashtra lost thermal capacity while demand grew faster. It fills the gap today with imports from other states. Batteries are coming: the state utility has awarded about 2,000 MW of two-hour storage and is tendering 1,000 MW of four-hour storage, scheduled to discharge from 5 pm to 7 am. Texas built its batteries first but Maharashtra is buying them with the night hours already in mind.
Maharashtra Peak Demand Growing
The CEA reports that Maharashtra met its peak demand in full in fiscal year 2024-25. The monthly data says otherwise. In August 2024, 2,218 MW of demand went unmet, 7.9% of that month's peak. In September 2024 the figure was 3,506 MW, or 11.7%. The annual line shows zero because the year's peak fell in March, when supply was adequate.
Shortfalls like these are often put down to distribution limits, commercial reasons and plant outages rather than a lack of generation. That is a fair caveat. It does not help a data center. A data center draws close to the same load in September as in March. The grid is planned around its annual peak. The data center needs the hour that is short, whenever it falls.
Maharashtra Power Import Export Difference
Unlike Texas, Maharashtra is not an island. It draws on plants in other states through a national grid with more than 118,000 MW of transfer capacity between regions. Its hydro and nuclear plants are also dispatchable, and they are left out of this ratio. Add them back and coverage is 98%, not 84%.
I accept most of that. Importing at the peak is not a failure. But two points remain. First, the CEA's own outlook for 2026-27 puts Maharashtra's peak at 36,858 MW against 34,721 MW of expected availability, a 5.8% gap. Even if that demand forecast proves 11% too high, as last year's did, coverage would be about 80%. Second, a market supplies the peak hour at the peak price. Firming does not disappear when it is imported. It is paid for by whoever holds the contract.
Readers of my article Cheap Coal pushed back in three directions. One argued that the real constraint in western India is transmission, not generation, and pointed to rising curtailment of renewables. Another said onsite power will struggle in Mumbai on land cost and emission rules, and that demand will simply spread to Pune, Chennai and Hyderabad. A third said the India question is carbon, not speed, because tenants with net-zero pledges will pay for cleaner power.
All three are fair. None of them removes the firm-capacity question. Curtailed solar at noon does not help an evening peak in September. Pune is in Maharashtra, so moving there does not change this ratio, and a renewable power purchase agreement matched over a year does not say whose plant is running at the peak hour. As I said in reply to one comment, accurate time matching in India will be hard.
One reader asked a question I still cannot answer well: what connection timelines are developers being quoted in Mumbai today? If you know, I would like to hear it.
Data Center Implications
In October, Tata Power announced a ₹15,000 crore (about $1.5 billion) plan to upgrade its Mumbai network, including a new 400 kV transmission ring, with 29 active workstreams across 18 data center operators. That solves delivery. It does not create the megawatts at the far end of the wire.
In the US, the scarce item is time, in most of India it still is not. In Maharashtra, the scarce item is becoming firm capacity at the peak hour, and the open question is who carries that risk. It can sit with the utility, through a green tariff priced to cover it. It can sit with the operator, through contracts for storage or firm supply. Or it can sit onsite, as backup that is expected to run more often than backup usually does. Each choice has a different cost and a different carbon outcome. None of them is free.
This is where the Temporal Trilemma applies. The state's thermal margin went from surplus to shortfall in six years. A transmission ring, a new plant or a pumped hydro scheme takes most of that time to build. The margin is moving on a shorter clock than the assets that would restore it.
What to Watch
In Cheap Coal I said the indicator to watch was connection timelines in Mumbai. I would now add three more. The Thermal Coverage Ratio, updated each year. Maharashtra's monthly unmet peak in August and September. What firm capacity, if any, stands behind the round-the-clock supply that data center operators are signing in the state?
The Figures
Thermal coverage fell from 115% to 84% while Texas fell from 98% to 83%. Fewer than five data points, so a table rather than a chart. For the website, use the table as is, or a simple two-market bar image (Texas and Maharashtra, start and end).
| Measure | FY2019-20 | FY2025-26 | Change |
|---|---|---|---|
| Peak demand (MW) | 24,550 | 31,128 | +6,578 (+27%) |
| Coal (MW) | 24,966 | 23,316 | −1,650 |
| Gas (MW) | 3,207 | 2,819 | −388 |
| Coal and gas (MW) | 28,173 | 26,135 | −2,038 (−7%) |
| Thermal Coverage Ratio | 115% | 84% | −31 points |
| Surplus or gap (MW) | +3,623 | −4,993 | |
| Coal only | 102% | 75% | |
| With nuclear and hydro added | 133% | 98% | |
| Renewables (MW) | 9,779 | 30,148 | 3.1x |
Method: the Thermal Coverage Ratio, applied to plants located in Maharashtra. Coal and gas only. Nuclear (1,400 MW) and hydro (3,047 MW) are reported separately. The full series and sources are in the downloadable workbook.
Disclosure: This analysis is my own, uses only public data, and is published independently.
Downloads
Maharashtra Thermal Coverage Ratio Data Pack
Five Nines and Fast Power
Making Better Decisions in AI Energy Investments
Sources
Installed capacity (Central Electricity Authority, location-wise tables)
Central Electricity Authority. (2020). All India installed capacity of power stations: Western region, July 2020. National Power Portal.
Central Electricity Authority. (2026). All India installed capacity of power stations: Western region, July 2026. National Power Portal.
Peak demand, shortfalls and forecasts (Central Electricity Authority)
Central Electricity Authority. (2020). Load generation balance report 2020-21. Source of the FY2019-20 peak.
Central Electricity Authority. (2024). Load generation balance report 2025-26. Source of the August and September 2024 unmet peaks.
Central Electricity Authority. (2025). Load generation balance report 2026-27. Source of the FY2025-26 peak and the FY2026-27 forecast.
Transmission and grid
Ministry of Power. (2025). Reply to parliamentary question on inter-regional transmission capacity. Inter-regional capacity of 118,740 MW as of December 31, 2024.
W.Media. (2026, October 15). Tata Power announces US$1.5 billion Mumbai grid expansion for data centers.
Battery storage
Renewable Watch. (2026, September 28). MSEDCL floats 1,000 MW BESS tender.
Data center market
CXOToday. (2026). CBRE H1 2026 report: India data center capacity hits 1.75 GW, set to cross 2 GW by year-end. Source of Mumbai’s 94% share of new capacity in H1 2026.
Related analysis on this site
Marshall, A. (2026). Thermal Coverage Ratio. Definition and method.
Marshall, A. (2026). Texas peak demand grew 22%. Its dispatchable thermal fleet grew 3%. Source of the Texas comparison.
Marshall, A. (2026). Cheap coal, expensive flexibility.
Questions and Answers
What is the Thermal Coverage Ratio for Maharashtra?
It is the share of the state’s peak demand that coal and gas plants located in Maharashtra could meet on their own. It was 115% in fiscal year 2019-20 and 84% in 2025-26.
What changed between 2019-20 and 2025-26?
Peak demand grew 27%, from 24,550 MW to 31,128 MW. Coal and gas capacity fell 7%, from 28,173 MW to 26,135 MW. A surplus of about 3,600 MW became a gap of about 5,000 MW.
Why are hydro and nuclear left out?
The same rules are used as in Texas, so the two can be compared directly. Maharashtra’s 1,400 MW of nuclear and 3,047 MW of hydro are reported separately. Adding them back raises the 2025-26 figure to 98%. Even on that wider measure, the state has gone from a large surplus to slightly under its own peak.
How does Maharashtra compare with Texas?
They are almost level: 84% and 83%. Texas added a little thermal capacity and filled the gap with 19 GW of batteries already running. Maharashtra lost thermal capacity while demand grew, and fills the gap mainly with imports from other states.
Does Maharashtra have battery storage?
Very little is running today. The state utility, MSEDCL, announced results of a 2,000 MW, two-hour battery tender in September 2026. It is now tendering a further 1,000 MW of four-hour storage, scheduled to discharge from 5 pm to 7 am. Texas built its batteries first. Maharashtra is buying them with the night hours in mind.
Does a ratio below 100% mean power cuts?
No. Maharashtra imports power through the national grid, and installed capacity is not the same as availability on a given day. The ratio shows how much the state relies on supply from outside its borders at the peak, and who pays for it.
What does the outlook for 2026-27 show?
The CEA expects peak demand of 36,858 MW against 34,721 MW of available supply, a 5.8% gap. Against that forecast, the ratio would be 71%. If the forecast proves as high as last year’s, it would be about 80%.
Why does this matter for data centers in Mumbai?
Data centers draw almost the same power every hour of the year. In Maharashtra the open question is becoming who provides firm capacity at the peak hour, and who pays for it. That could be the utility, the operator through storage or firm contracts, or onsite generation.
Where does the data come from?
Installed capacity comes from the Central Electricity Authority’s location-wise tables for July 2020 and July 2026. Peak demand comes from CEA Load Generation Balance Reports. The full workbook is in the downloadable data pack.