Two Kinds of Grid Stress, and Why Data Centers Keep Designing for the Wrong One
Renewables share does not predict grid instability. Grid stress comes in two forms. Each one calls for a different power architecture.
A photograph of wind turbines and a nearby lightning strike
The wrong lesson from Iberia
On April 28, 2025, shortly after midday, the power system in Spain and Portugal collapsed. Trains stopped mid-journey, traffic lights went dark and hospitals ran on backup generation. Within hours, social media had settled on an explanation. Too much solar, not enough spinning mass resulting in a grid pushing past its limits.
The investigations told a more specific story. The Spanish government's report and the ENTSO-E expert panel pointed to a cascade of overvoltage events and insufficient voltage control, with generators disconnecting as voltage climbed. The problem was not the presence of renewables, it was how the system was controlled around them.
That distinction matters well beyond Iberia. It matters most to anyone deciding how to power a data center.
Renewables, Grid Stress and Onsite Power Architecture
First, a country's wind and solar share does not directly predict grid instability. The data presented in this piece demonstrates the relationship actually runs the other way.
Second, grid stress comes in two distinct forms: chronic and acute. They have different causes, different warning signs, and different geographies.
Third, each form calls for a different onsite power architecture. Designing for the wrong one is among the most expensive mistakes in data center development.
What the maps show
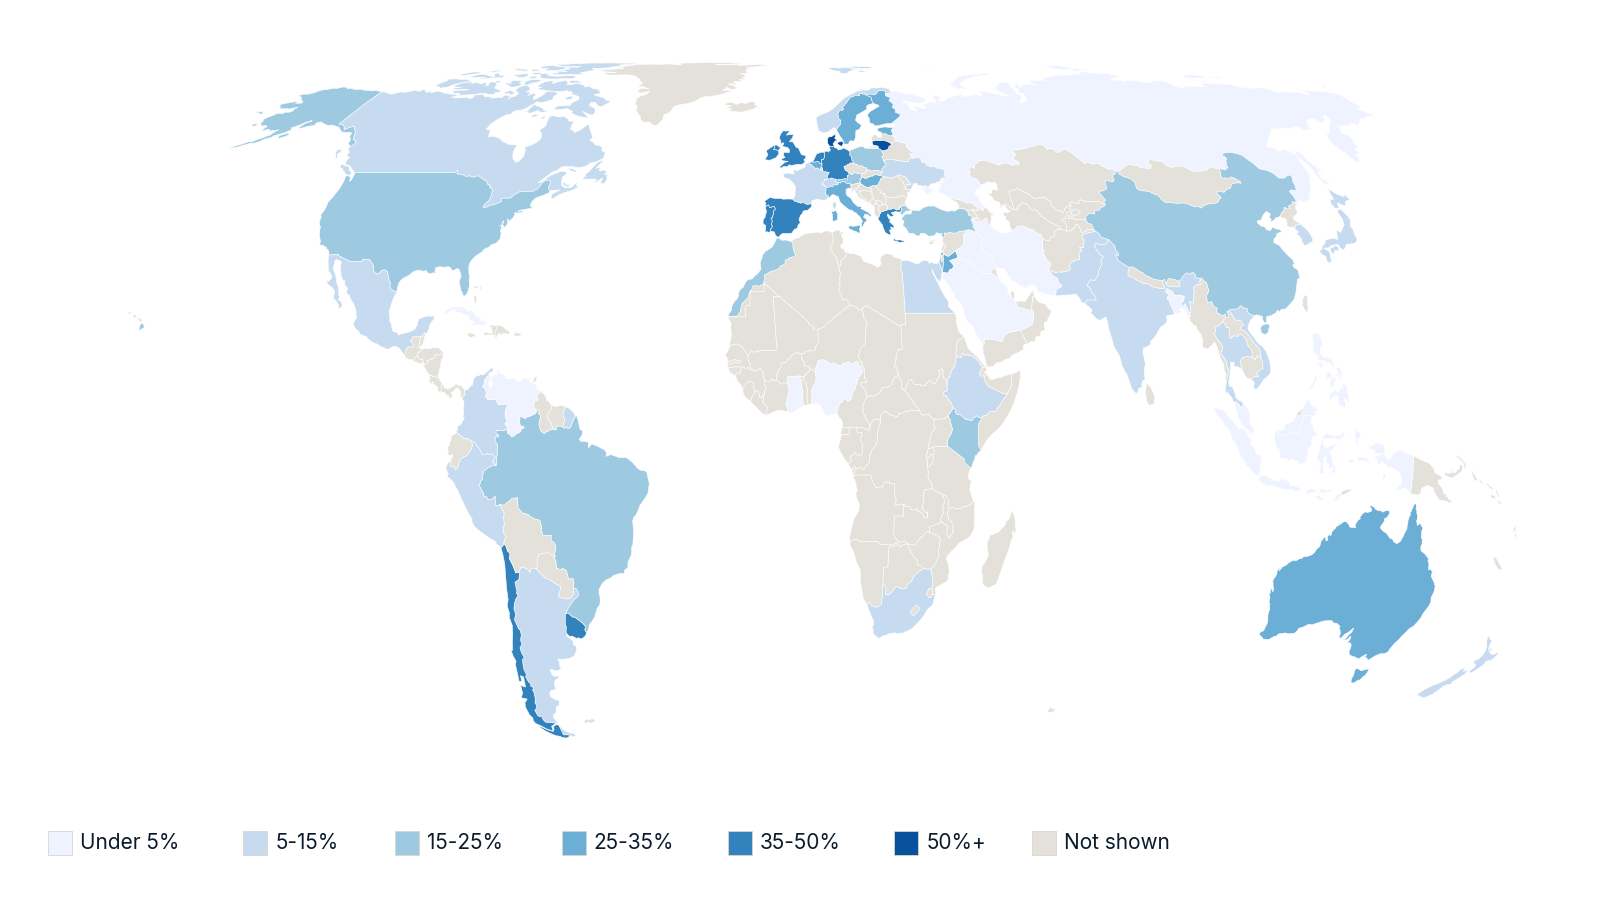
Figure 1. Wind and solar share of electricity generation, approximate 2024 values.
Northern Europe and Iberia lead. Denmark generates around three fifths of its grid supplied electricity from wind and solar. Much of Africa, the Middle East, and South Asia sits close to zero.
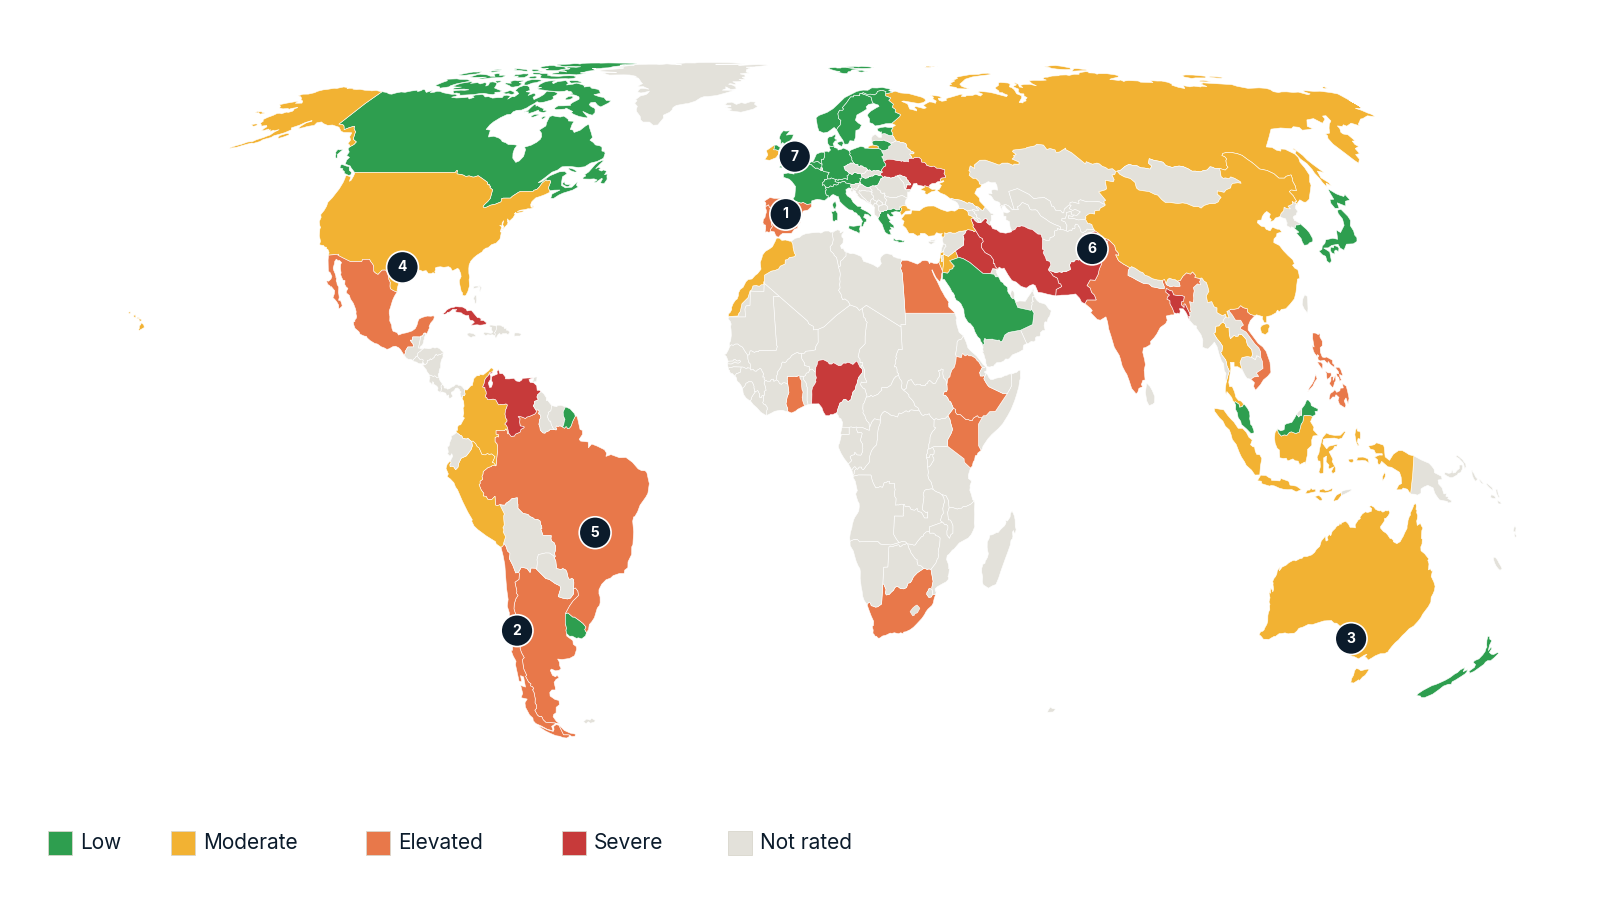
Figure 2: Grid stress tier by country. Numbered markers: 1 Iberia 2025, 2 Chile 2025, 3 South Australia 2016, 4 Texas 2021, 5 Brazil 2023, 6 Pakistan 2023, 7 Great Britain 2019.
Severe stress clusters in countries where wind and solar barely register.
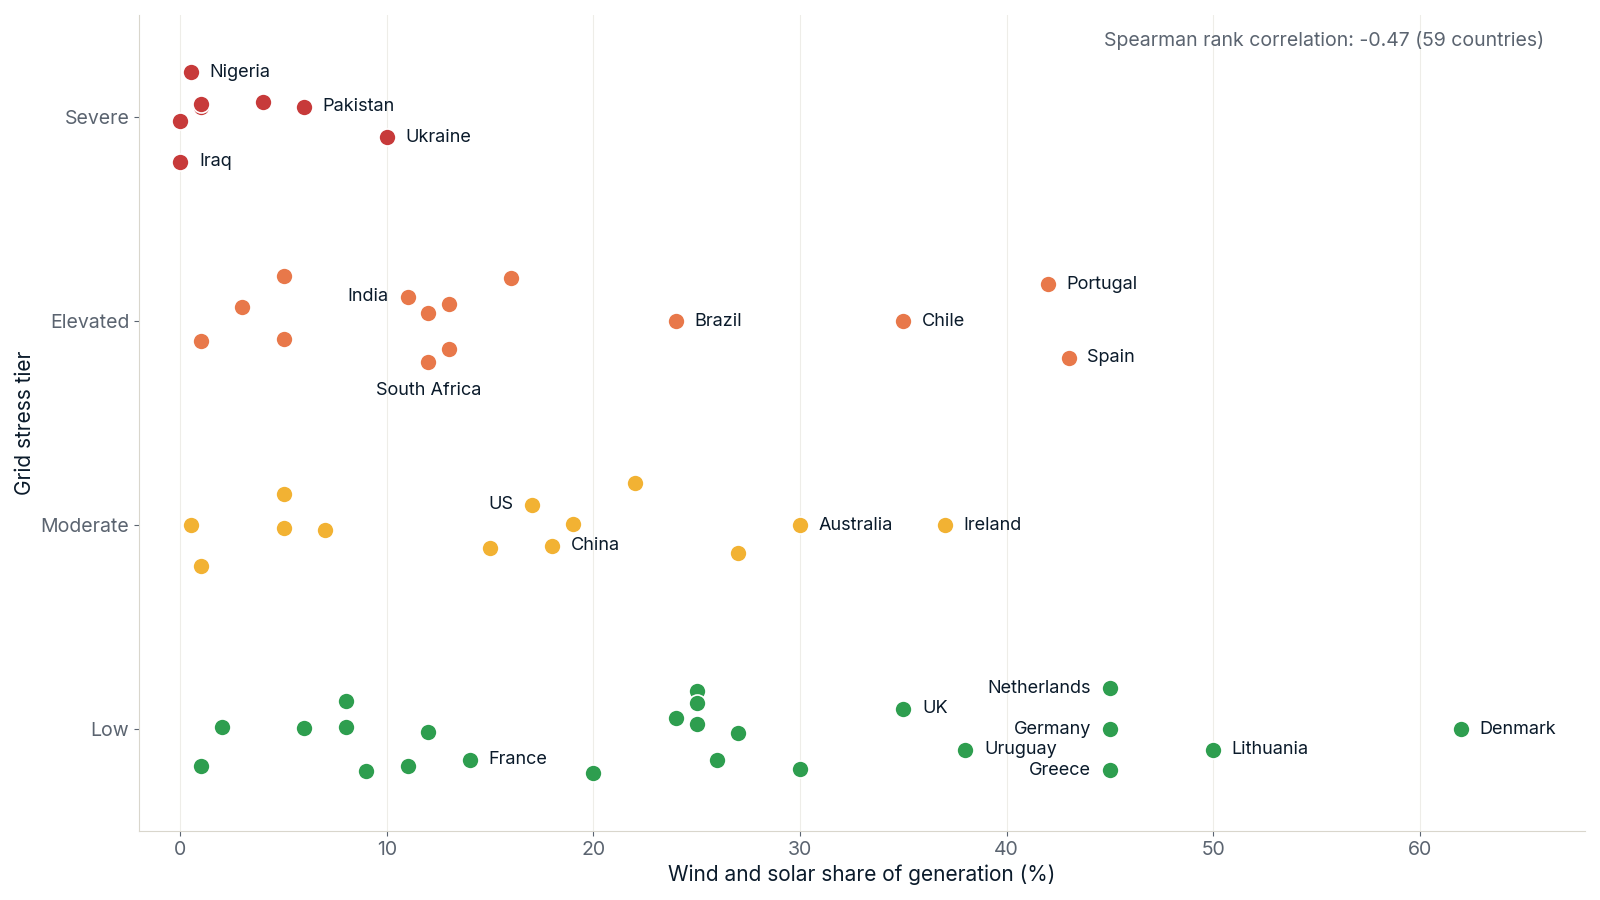
Figure 3. Wind and solar share against grid stress tier, 59 countries.
The rank correlation across 59 countries is -0.47. Countries above 25% wind and solar average a stress tier of 1.5 on a four-point scale. Countries below 5% average 3.0. Half of the lowest-share countries sit in the severe tier.
Therse figures should not be interpreted as renewables making grids stronger. The high-share countries are mostly wealthy, well interconnected, and well regulated. They built wind and solar on alongside grids that already worked. The severe-tier countries mostly struggle with fuel supply, utility finances, and years of underinvestment. Renewables share has historically been a marker of a system's wealth more than a cause of its reliability.
What the data does rule out is the simple story. If adding wind and solar degraded reliability in a straight line, Denmark, Germany, and the Netherlands would not sit in the lowest-stress tier.
Two kinds of grid stress
Chronic grid stress
Definition: A persistent gap between the electricity a system needs and what it can reliably deliver, experienced as frequent and often scheduled outages.
Causes: Too little generation capacity. Unreliable fuel supply. Loss-making utilities that cannot fund maintenance. Weak transmission.
Warning signs: Published load-shedding schedules. High outage frequency reported by businesses. Diesel generators on every commercial rooftop.
Where: Nigeria, Pakistan, Iraq, Iran, Bangladesh. South Africa through 2023.
Wind and solar share: Mostly under 5%.
Chronic stress is predictable, businesses plan around this instability, and the grid becomes the secondary supply.
Acute grid stress
Definition: Rare, high-impact failures in which a single disturbance cascades into a regional or system-wide outage.
Causes: Falling system strength and inertia. Gaps in voltage control. Protection and ride-through settings that behave differently from their models. Limited interconnection with neighbors.
Warning signs: Infrequent but large events. Operator emergency directions. Rising spend on stability services.
Where: Iberia, South Australia, northeast Brazil, Great Britain.
Wind and solar share: Often 25% or more.
Acute stress is hard to predict and the grid works almost all the time. That is exactly what makes it dangerous as it invites designs that assume it always will be.
Hybrids
Some markets carry both kinds of stress, or are moving from one to the other.
South Africa. Chronic stress driven by coal fleet performance. Load shedding has been largely suspended since 2024, while wind, solar, and rooftop PV have grown fast.
Pakistan. Chronic stress, plus a surge in imported solar panels that is moving demand behind the meter and eroding utility revenue. That could deepen chronic stress rather than relieve it.
Ireland. High wind share and low outage rates, but repeated capacity adequacy warnings and a cap on instantaneous non-synchronous generation. Data center demand sits at the center of that debate.
Hybrids are where site selection gets hard. Many of the growth markets for data centers fall into this group.
Notable Global Electricity Grid Disruptions
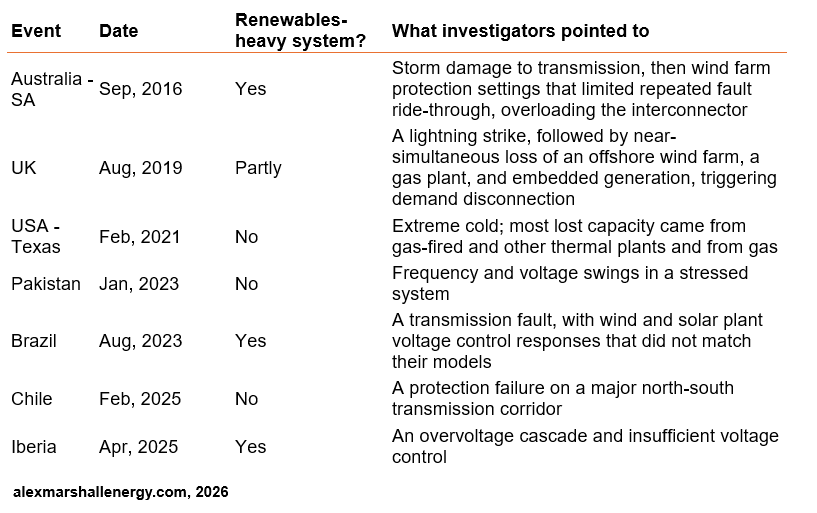
Figure 4: A table of notable grid events 2016-2025
Data centers are now part of the acute story
In July 2024, a transmission fault in Northern Virginia caused roughly 1,500 MW of data center load to switch to backup power at once, according to NERC's incident review. The grid had to absorb a sudden loss of load the size of a large power station. Grid operators now treat large loads as a stability challenge in their own right.
The implication is uncomfortable. At scale, data centers are no longer only exposed to acute stress. They can contribute to it. How their power systems behave during a fault is becoming a grid code question, not just a design choice.
What this means for data center power
Same asset class, but a different design brief.
In chronic-stress markets
The grid is the secondary supply, and onsite generation is required to be the primary. That changes almost everything.
Rate generation for prime or continuous duty. Standby-rated equipment run as prime is a reliability and warranty problem waiting to happen.
Put redundancy on the generation itself. N+1 belongs on the engines, not only on the UPS.
Treat fuel as the critical path. Gas availability, pipeline pressure, and storage decide uptime more than equipment selection does.
Capture the heat. Running hours are high, so CHP and cooling integration pay back faster.
This is the territory covered in the Five Nines and Fast Power.
In acute-stress markets
The grid is reliable almost all of the time and the design brief is the rare event.
Specify ride-through behavior, not just backup capacity. Know what your site does in the first seconds of a disturbance, and what the grid operator expects it to do.
Consider grid-forming capability, either in the onsite generation or in the storage layer.
Design for islanding and black start. Test transfer under realistic fault conditions, not only planned switchovers.
Make firm onsite capacity work for the grid too. Stability services and load flexibility can shorten the path to interconnection. See speed-to-power.
Everywhere
Ask which kind of stress your site faces before you choose the architecture. The answer changes the equipment, the contracts, and the capital case.
The cost of mistake runs in both directions. Design for chronic stress in an acute market, and you strand capital in prime-rated generation that rarely runs.
Design for acute stress in a chronic market, and a standby fleet runs thousands of hours a year, wears out early, and leaves you exposed. Both are expensive, the second is usually worse.
The strongest objection
Critics will call this distinction convenient. Synchronous generation used to provide voltage control and inertia as a by-product. Displace it with inverter-based plant, and you open the gap. So renewables did cause the acute stress, even if indirectly.
That is partly right. The services that synchronous plant provided were real, and they were undervalued for years.
But the failure was one of sequencing. Systems sidelined those services before they procured replacements. The replacements exist. Grid-forming inverters, synchronous condensers, and flexible thermal generation can all supply them.
This is the core of the Structured Transition Model. Transitions fail when retirement runs ahead of replacement. The fix is structure, not retreat.
A prediction
By December 31, 2028, at least two of ERCOT, PJM, EirGrid, and AEMO will have binding fault ride-through requirements that apply specifically to large data center loads.
Method and data
Wind and solar share. Approximate 2024 values, as a percentage of total electricity generation, at national level. Source: Ember.
Grid stress tier. A four-level author assessment for 59 countries. It combines supply reliability with system-wide events since 2016. It is a judgment, not a published index.
Limitations. The tiers were assigned with knowledge of each country's renewables share, so the correlation partly reflects the author's view. National figures also hide the subnational systems where much of this plays out, including ERCOT, CAISO, and South Australia.
Next version. The stress tier will be replaced with two measured axes:
Chronic stress: outages in a typical month, from the World Bank Enterprise Surveys, with SAIDI where regulators publish it.
Acute stress: the number of system-wide events over ten years, drawn from system operator reports.
The correlation will be recomputed on that basis.
Your turn
Which archetype is your next site in? I'm most interested in the markets that sit in both. Tell me where you're building and what you're seeing.
Five Nines and Fast Power
Making Better Decisions in AI Energy Investments